Councils provide the local public services and local infrastructure that communities need to survive and prosper. Nothing, however, is free. Local services need to be paid for and local government has a limited range of funding tools by which to meet the expectations and need of not only today’s communities but the communities of the future.
How do councils pay for services?
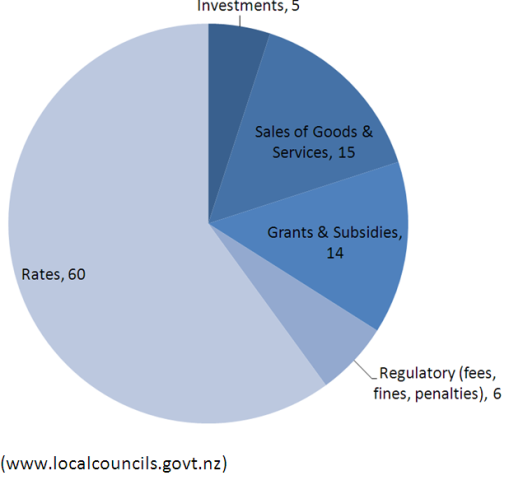
Unlike local governments in many other countries, New Zealand councils rely on a single form of tax, property tax. The power to levy a property tax is contained in the Local Government (Rating) Act 2002. In addition to their ability to levy property taxes councils receive income from a range of additional sources, see figure 1. These are:
- sale of goods and services, such as swimming pool charges;
- regulatory fees, such as parking fines and infringements;
- interest earned from investments, including Council Controlled Trading Organisations (CCTOs); and
- grants and subsidies, primarily the local government share of roading taxes and charges and development contributions.
Figure 1: Local government income – year ending 30 June 2011

Although provided with only a single form of tax, a property tax, councils have a wide range of choices in how they apply that tax. For example property taxes may take the form of:
- general rates – based on the land, capital or rental value of a property (with the exception of Auckland Council which is required to use capital value)
- targeted rates – rates calculated on the basis of a feature of a property and used to fund a specific service, such as funding the cost of a sea wall to halt erosion based on the frontage size of affected sections
- uniform annual general charges (UAGC) – a standard cost per property, not related to property value (only 30% of rates can be made up of UAGCs).
Key financial statistics
|
Share of GDP |
3.8% |
|
Share of public spending |
11% |
|
Total assets |
$124 billion |
|
Debt as % assets |
8.6% |
|
Proportion of household expenditure spent on rates |
2.25% |
|
Proportion of revenue spent on debt servicing |
6.4% |
|
Proportion own-sourced income |
90% |
Information on what proportion of councils' rates are made up of each of these categories can be found in each council’s Funding Impact Statement (FIS) and Rating Resolution.
Where does the income go?
In the 2010/11 year councils’ expenditure was allocated to the following types of activities:
|
Purchasing goods and services |
42% |
|
Employee costs |
21% |
|
Depreciation |
20% |
|
Grants and subsidies |
11% |
|
Interest expenses |
6% |
(Source www.localcouncils.govt.nz)
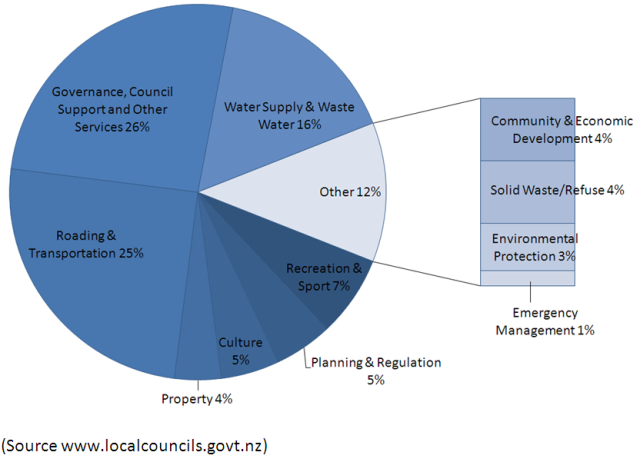
Figure 2 shows the allocation of expenditure across the different services provided by the local government sector.
Figure 2: Expenditure by activities

The single largest expenditure category is governance, which includes council support and other support services, followed by roading and drinking and waste water.
